In Federated Learning we leave the data at the source and only share insights. To users of the vantage6 solution there is often a lot of confusion how data flows in the system and the server is often confused with the aggregator of the algorithm. In this blog we first discuss the individual components, followed by a projection of a simple average algorithm.
Simple Average Algorithm
Computing an average is quite straight forward. You sum all the values and divide them by the number of values. In python it would look something like:
x = [1,2,3,4,5]
average = sum(x) / len(x)
In a federated data set the values for x are distributed over multiple locations. Let's assume x is split into two parties:
a = [1,2,3]
b = [4,5]
In this case we can compute the average as:
average = (sum(a) + sum(b))/(len(a) + len(b))
The goal is to compute the average without sharing the individual numbers. In this case we only need to share the sum and number of elements of each dataset.
Infrastructure Components
The infrastructure consists of three separate components:
- Client. User or application that uses vantage6 to gain insights from data. They connect directly to the server by using its API.
- Server. Hosts several services.
- API to which clients can post tasks and retrieve their results.
- (Optional) Docker registry to store algorithms
- (Optional) EduVPN instance to allow for direct communication between algorithm containers
- Node. Application that retrieves algorithms, executes them with their local data and returns the results to the server.
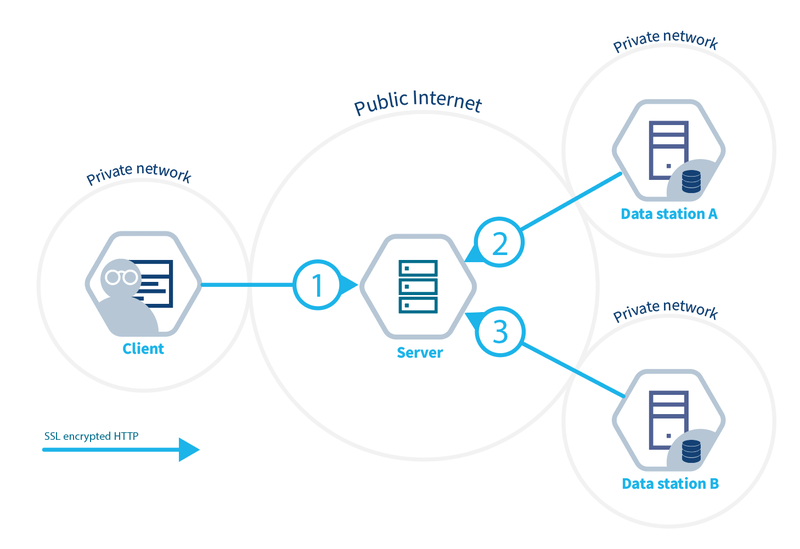
Infrastructure overview
This is a client-server model. However in vantage6 there is also a peer-to-peer model which allows communication between algorithms which run at different data stations. In this blog we do not discuss this type of communication, we might do that in a follow up.
Algorithm Projection on the Infrastructure
The algorithm has a central part and a federated part. The central part is responsible for creating tasks, obtaining their results and aggregation of these results. For more complex algorithms, this can be an iterative process. In the figure below, the pink hexagon is the central part and the green hexagon is the federated part (subtask) of the algorithm.
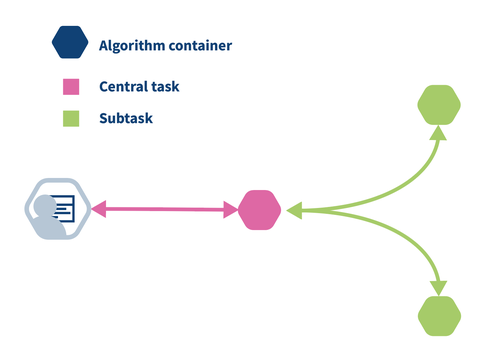
To compute a federated average, each of the green containers computes partial_sum = sum(data) and partial_count = len(data) and shares this with the pink container. When the pink container receives the results from both green containers, it aggregates the partials to a global average.
It is easy to confuse the server with the central part (also called aggregator or master task). The server is the central part of the infrastructure but not the place where the central part of the algorithm is executed. The central part (also called the master task) is executed at one of the nodes. So if we project the algorithm containers on the infrastructure we obtain the figure below.
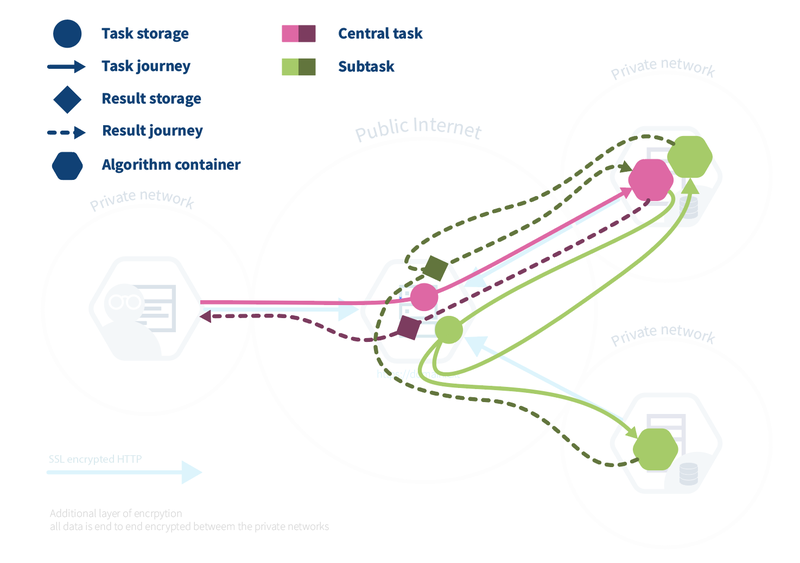
At the central server, it is only registered that a user creates a central task (pink circle). Then, on one of the nodes, the central algorithm (pink hexagon) is run. The central algorithm creates new assignments (green circle) at the central server, which lead to the execution of the subtasks on the nodes (green hexagons). Each node produces a partial result which is registered on the server (green square). Finally, the central algorithm combines these partial results and sends the global result (pink square) to the server.